Linux上常用程序记录工具有strace、ltrace等,能够记录到程序的系统调用以及API函数调用信息,但是均无法得到进一步的调用位置等,hutrace则同时利用dynamorio实现了基本块以及指令状态等的记录,功能与Windows平台保持一致,本文仅对与win有差异的部分进行简单介绍,且Linux平台能公开的样例较少,内容偏少一点。
基本用法 Linux下的hutrace使用与Windows基本一致:
1
2
3
4
5
6
7
8
9
10
11
12
13
14
15
16
17
18
19
20
21
22
23
24
# huhu @ huhu in ~/Desktop/my/build/bin64 [9:58:27] C:127 $ ./hutrace ERROR: Usage error: Usage: -logdir [ .] Log directory to print library call data -only_from_app [ false] Reports only library calls from the app -trace_to_librarys [ ""] Trace specify librarys -record_start_addr [ ""] record begin at start_addr -record_end_addr [ ""] record finished at end_addr -follow_children [ false] Trace child process -print_ret_addr [ false] Print library call's return address -print_ins_info [ false] Print instructions disassemble info -print_ins_reg [ false] Print instructions disassemble reg -print_ins_all [ false] Print instructions trace info -print_syscall [ false] Print syscall info -num_unknown_args [ 2] Number of unknown libcall args to print -num_max_args [ 6] Maximum number of arguments to print -config [ ""] The path to custom config file. -ignore_underscore [ false] Ignores library routine names starting with "_". -only_to_lib [ ""] Only reports calls to the library <lib_name>. -help [ false] Print this message. -version [ false] Print version number. -verbose [ 1] Change verbosity. -use_config [ true] Use config file
拿一个最简单的例子来演示,一个比较老的ctf的最简单题,flag解密后直接比较,不过其中夹杂了一些main函数等位置cc断点的检测:
1 $ ./hutrace -only_from_app -print_ret_addr -print_ins_info -- ./noccbytes
查看trace得到的API记录:
1
2
3
4
5
6
7
8
9
10
11
12
13
14
15
16
17
18
19
20
21
22
23
24
25
26
27
28
29
30
31
32
33
34
35
36
37
38
39
40
C7ffff3d8dbb7|7ffff3d8d8a0 7ffff3d8d8a0: jmp <rel> qword ptr [0x00007ffff3f8ef98] J7ffff3d8d8a0|7ffff6829a50 ~~5820~~ libc.so.6!strcpy N:0x42 arg 1: WattoSays (type=char*, size=0x0) and return to module id:4, retraddr: 0x7ffff3d8dbbc,offset:0xbbc 7ffff3d8dbbc: lea rdx, [rbp-0x30] mov rax, qword ptr [rbp-0x38] mov rsi, rdx mov rdi, rax call 0x00007ffff3d8d8d0 and strcpy return value: 0x7fffffffda20 arg 0: WattoSays (type=char*, size=0x0) C7ffff3d8dbca|7ffff3d8d8d0 7ffff3d8d8d0: jmp <rel> qword ptr [0x00007ffff3f8efb0] J7ffff3d8d8d0|7ffff68235f0 ~~5820~~ libc.so.6!strcmp N:0x43 <----最终解密的password在此比较 arg 0: 1234567890 (type=char*, size=0x0) arg 1: WattoSays (type=char*, size=0x0) and return to module id:4, retraddr: 0x7ffff3d8dbcf,offset:0xbcf 7ffff3d8dbcf: test eax, eax jnz 0x00007ffff3d8dbda and strcmp return value: 0xffffffda 7ffff3d8dbda: lea rdi, <rel> [0x00007ffff3d8de19] call 0x00007ffff3d8d8f0 C7ffff3d8dbe1|7ffff3d8d8f0 J7ffff3d8d8f0|7ffff67f36a0 ~~5820~~ libc.so.6!puts N:0x44 arg 0: Wrong Password (type=char*, size=0x0) and return to module id:4, retraddr: 0x7ffff3d8dbe6,offset:0xbe6
当然ltrace也可以做到哦~只是hutrace得到的信息更为丰富。
多进程分析 Linux下进程创建方式比较多样,而Fork又有别于常规的进程创建方式,导致hutrace需要额外处理Linux上常见的Fork进程的记录问题,当然处理难度不大,来看下最简单的演示程序:
1
2
3
4
5
6
7
8
9
10
11
12
13
result = fork(); if(result == -1) { printf("Fork error\n"); } else if (result == 0) { printf("The returned value is %d In child process!! My PID is %d\n",result,getpid()); } else { printf("The returned value is %d In father process!! My PID is %d\n",result,getpid()); }
开工:
1
2
3
$ ./hutrace -only_from_app -print_ret_addr -print_ins_info -- ./myproctest.out The returned value is 7774 In father process!! My PID is 7773 The returned value is 0 In child process!! My PID is 7774
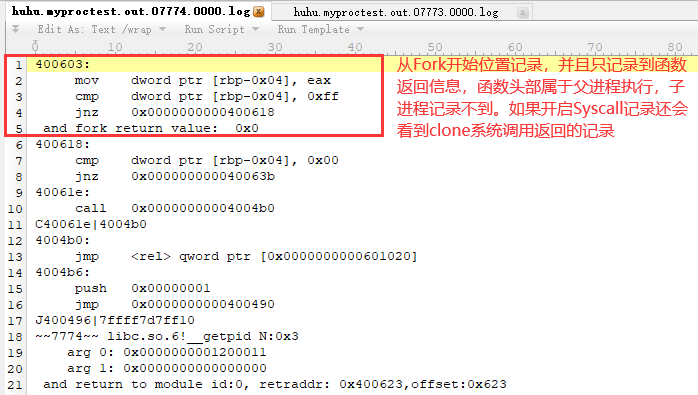
我们只看下子进程的记录日志:
常规方式的进程创建没啥特别的,不再说了,可惜Linux上dynamorio不支持Windows上的-syswide_on功能。
Linux Syscall调用记录 上一篇中介绍的windows系统调用使用常见相对小众,Linux下就比较常见了,hutrace在linux系统上同样默认不记录syscall调用信息,而且不在hutrace.config中设置参数信息的话只打印系统调用名称,只有设置了参数信息才会打印系统调用的参数,实际使用时和打印API函数以及上一篇Window应用中介绍的使用方式类似,在hutrace.config配置文件中添加对应syscall的参数信息:
1
2
3
4
5
6
7
8
hutrace.config文件中设置: int|syscall_read|LONG|__out hex^ARG2|int int|syscall_write|LONG|char * int|syscall_open|char *|LONG 运行hutrace记录ls程序运行的syscall: # huhu @ huhu in ~/Desktop/my/build/bin64 [8:17:52] $ ./hutrace -only_from_app -print_ret_addr -print_syscall -- /bin/ls -al
得到的部分日志记录:
1
2
3
4
5
6
7
8
9
10
11
12
13
14
15
16
17
18
19
20
21
22
~~127677~~ S|syscall_open_2 N:0x4 arg 0: /etc/ld.so.cache (type=char*, size=0x0) arg 1: 0x80000 (type=long, size=0x8) and syscall_open return S|read0 ~~128056~~ S|syscall_read_0 N:0xa arg 0: 0x4 (type=long, size=0x8) arg 2: 0x340 (type=int, size=0x4) and syscall_read return arg 1: 0x00007fffffffd3e8 000000: 7f 45 4c 46 02 01 01 00 00 00 00 00 00 00 00 00 .ELF............ 000010: 03 00 3e 00 01 00 00 00 b0 5a 00 00 00 00 00 00 ..>......Z...... 000020: 40 00 00 00 00 00 00 00 30 f5 01 00 00 00 00 00 @.......0....... 000030: 00 00 00 00 40 00 38 00 08 00 40 00 1e 00 1d 00 ....@.8...@..... //省略0x340剩余部分显示 (type=__out hex^ARG2*, size=0x340) S|write1 ~~128056~~ S|syscall_write_1 N:0x3aa arg 0: 0x1 (type=long, size=0x8) arg 1: drwxrwxr-x 5 huhu huhu 4096 Apr 25 08:11 .. (type=char*, size=0x0) and syscall_write return
仅这一部分可打印16进制数据的功能就比strace打印的更友好点了~而且strace本身基于ptrace实现的,遇到基于ptrace实现的一些反调试技术就无法继续追踪了:
1
2
3
4
5
6
7
8
9
10
11
$ strace ./myptrace-simple.out //部分结果 ptrace(PTRACE_TRACEME) = -1 EPERM (Operation not permitted) fstat(1, {st_mode=S_IFCHR|0660, st_rdev=makedev(4, 1), ...}) = 0 ioctl(1, TCGETS, {B38400 opost isig icanon echo ...}) = 0 brk(NULL) = 0x8402000 brk(0x8423000) = 0x8423000 write(1, "don't trace me\n", 15don't trace me <-----ptrace检测 ) = 15 exit_group(1) = ? +++ exited with 1 +++
对比hutrace的结果:
1
2
3
4
5
6
7
8
9
10
11
12
13
14
15
16
17
18
19
20
21
22
23
24
25
$ ./hutrace -only_from_app -print_ret_addr -print_ins_info -print_syscall -- ./myptrace-simple.out no one trace me //部分trace结果 ~~12192~~ libc.so.6!ptrace N:0x1a arg 0: 0x0000000000000000 arg 1: 0x0000000000000000 and return to module id:4, retraddr: 0x7ffff3d8e6ac,offset:0x6ac S|ptrace101 ~~12192~~ S|syscall_ptrace_101 N:0x1b and syscall_ptrace return 7ffff3d8e6ac: cmp rax, 0xff jnz 0x00007ffff3d8e6c5 and ptrace return value: 0x0 <-----ptrace未检测到 7ffff3d8e6c5: lea rdi, <rel> [0x00007ffff3d8e773] call 0x00007ffff3d8e550 C7ffff3d8e6cc|7ffff3d8e550 7ffff3d8e550: jmp <rel> qword ptr [0x00007ffff3f8efc8] J7ffff3d8e550|7ffff6b756a0 ~~12192~~ libc.so.6!puts N:0x1c arg 0: no one trace me (type=char*, size=0x0) and return to module id:4, retraddr: 0x7ffff3d8e6d1,offset:0x6d1
不过目前还是存在一些基于ptrace的反调试技术如debugblocker等可能导致hutrace追踪失败的,可以只使用hutrace追踪父进程,提取其处理流程对程序进行patch等,后面如果有想到好点的解决方案也会添加进去。
Linux系统下任意地址hook插件编写 Linux系统上相比Window上利用hutrace加载自定义插件的限制更大,无法像Win上方便的利用GetModuleHandle获取除kernel32.dll、kernerbase.dll模块外其它模块的基址(上一篇提到过,当然dynamorio自己也有接口),虽然还有其它方法可以实现,但是目前想到的代价略微有点大,暂时也没有需求,后面如果有好的实现方法会更新下,暂时只支持固定地址方式进行Hook(不支持windows平台上hutrace插件的模块名+偏移的方式),下面来看一个演示例子,在hutrace.config中添加下述配置:
1
2
hook|null|0x400706|mylinuxplugin.so|f_hookpre|f_hookpost //和windows系统上的设置一样,如果hook的地址对应的并非一个函数,或者不需要对其函数返回状态进行hook,可以设置f_hookpost为null,否则可能会导致程序崩溃
目标程序0x400706为一个简单的打印参数函数:
1
2
3
4
5
6
7
8
9
10
11
12
13
// test_arg(1,2,3,4,5,6,7,8); __int64 __fastcall test_arg(unsigned int a1, unsigned int a2, unsigned int a3, unsigned int a4, unsigned int a5, unsigned int a6, unsigned int a7, unsigned int a8) { printf("a1:%d\n", a1); printf("a2:%d\n", a2); printf("a3:%d\n", a3); printf("a4:%d\n", a4); printf("a5:%d\n", a5); printf("a6:%d\n", a6); printf("a7:%d\n", a7); printf("a8:%d\n", a8); return 1LL; }
对应的Hook函数实现(my_fprintf函数指针由hutrace插件自动赋值,不用考虑其实现),通过hook方式将所有的参数设置为1:
1
2
3
4
5
6
7
8
9
10
11
12
13
14
15
16
17
reg_t f_hookpre(file_t outf, dr_mcontext_t *mc, reg_t ret_addr) { for (reg_t i = 1; i <= 8; i++) { my_fprintf(outf, "[hook]:get arg_%d: "PIFMT" \n", i,my_getarg(mc, i)); } //调用write函数也可以写入记录到trace日志文件,效果和my_fprintf一致 write(outf, "[hook]modify arg...\n", strlen("[hook]modify arg...\n")); for (reg_t i = 1; i <= 8; i++) { my_fprintf(outf, "[hook]:set arg_%d\n", i); my_setarg(mc, i, 1); } return 0; }
同样可以不依赖my_getarg、my_setarg等插件模板中已经实现好的函数对寄存器等进行修改(利用mc参数)~
总结 Windows上的调试分析工具很多且均比较完善了,Linux上gdb调试一些多进程程序都稍微麻烦点,另外稍微特殊的程序如利用错误section头部反调试的,虽然也可以gdb附加,但是使用hutrace来搞都没啥问题,特殊情况下hutrace无法运行的程序就要靠接下来介绍的hzytrace了,详见下一页基于pin实现的hzytrace具体介绍。